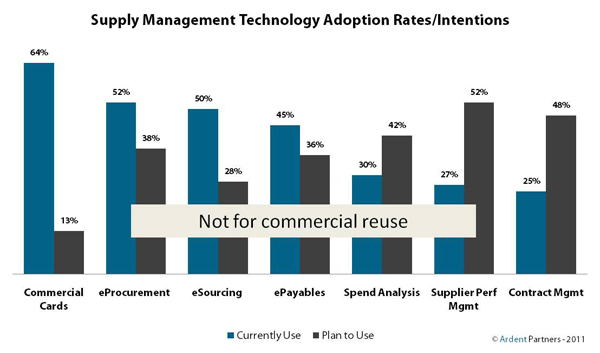
As part of our ongoing Adoption series, today we present the market adoption rates by enterprises of the primary supply management applications used to support the Source-to-Settle process.
I make no bones about being an advocate for the usage of these solutions because I have seen, first-hand (in my consulting days – recent past), the benefits that the solutions can deliver to specific procurement organizations and enterprises that take the right approach in launching and managing the solutions. I have also seen first-hand (in my research/analyst days – ongoing) what the average results that procurement organizations and enterprises in the marketplace have seen from the deployment of supply management solutions (I have also seen the disparity that exists between high and low performers). The goal of this Adoption series is to try to understand and address why the current adoption numbers are what they are and why they aren’t higher.
The chart below is a snapshot of the adoption rates of the different solutions in the market today[i] based upon my recent research report CPO Rising 2011: Innovative Ideas for the Decade Ahead which can be downloaded here or here, and soon here (registration required at each).
 This chart shows the different solutions in order of current usage rates defined as “Currently Use” (left to right) where Commercial Cards are in place at 64% of enterprises, while Contract Management solutions are in place at 25%. Not surprisingly, the highest adopted solutions have fewer enterprises planning to deploy them in the future defined as “Plan to Use.” (Note that the percentages of enterprises with “No Plans to Use” each solution are not shown).
Having presented the baseline today, we will continue next time with a more detailed analysis of this chart.
[i] It is important to note that all market research is not created equal. With any market research report, the data presented in it are representative of the respondents who participated and the demographics they represent. Sample size matters as do the specific demographics. Question structure and content are also very important as are the analytical ‘approach,’ ‘context’ and ‘capabilities’ of the analysts and companies that produce the research. When decisions are being based upon market research, it is very important to understand all of these elements.
Having written, managed, and directly overseen more than 100 distinct market research efforts focused on supply management, I believe that the data, approach, etc. used to support Ardent’s recent report is of the highest level. As an example, I personally know more than half of the participants in this research report (two-thirds of whom are executives within their organizations). That said, the demographics behind this specific chart (and all others from this effort) are included in the report; the survey pool tends to represent “large” (68%) enterprises based in North America (70%).
Tagged in: Adoption, Ardent Partners Research, Contract Lifecycle Management, ePayables, eProcurement, P2P, Source-to-Settle, Sourcing, Spend Analysis, Technology


