

We’ve spent the past few articles (here and here) looking at the impact that a procurement department’s net contribution can have on profitability and placed that impact in the relative context of the actual enterprise/business/industry that a specific procurement department is supporting by analyzing net profit margins.
When times are tough and top-line growth is hard to find, executive leaders look more closely at the non-sales levers that defend profit margins. Over the past 2+ years, procurement has been a major lever used by enterprises to drive success. Lately, many industries and enterprises appear to have turned the corner and show promising, if not actual, signs of growth; executive attention will surely turn back to the sales side of the house. We’re not suggesting that this is a mistake, to the contrary, astute executives make smart investments in the areas of the business that deliver the greatest returns; procurement is not always going to be the area that delivers the greatest returns (Sidebar: We will come back to discuss Procurement ROI as a performance metric – we feel it has limitations that warrant a discussion). We are suggesting that these executives need frequent reminders about the true returns or contributions from procurement and how those contributions impact profit margins. We are trying to equate procurement’s contribution with those made by other parts of the enterprise – they are not always given the same weight. Until more CEOs and CFOs develop a fuller understanding of the breadth of value that procurement can deliver, the reminders should be frequent; tactful and well-placed, but frequent (and, until more Chief Procurement Officers begin to extend their careers deeper into the executive ranks – more on this trend upcoming).
At the core, we feel that it is criminal that such a large number of procurement organizations consistently fail to gain approval for the relatively small investment in supply management solutions that can have a dramatic impact on overall performance. We think that the argument and discussion around procurement leverage, (how procurement savings equates to the nickels, dimes, and quarters in sales that must be generated to have an equal impact) is very powerful and can awaken the sleeping procurement giant within many enterprises.
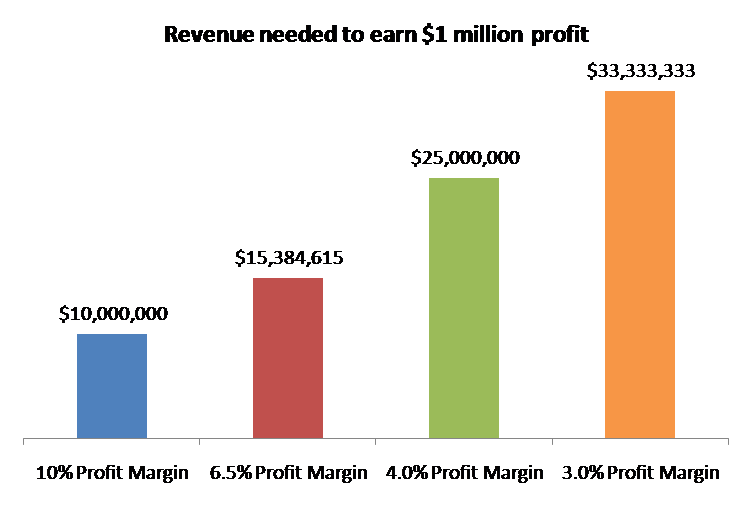
Last week, we presented a chart with an example of the amount of revenue needed to generate $1 million, based upon an enterprise’s hypothetical net profit margin. We also walked through the ‘procurement leverage’ analysis so readers can calculate their actual enterprise numbers to understand their actual impact. To save some time, we’ve also developed a list of average net profit margins by industryand the accompanying amount of revenue (in millions of dollars/eruos/pounds/kroners/rubles/real/yen/francs/pesos/yuan/rand/etc.) that is needed to generate a million profit in that same currency (below). The specific industry average can be used as an initial proxy to jump-start your analysis, but a determination should be made as to how that industry average number compares to the actual ones within your enterprise before making an executive presentation. Please comment or email if you’d like to discuss.
|
Industry Sector |
Average Net Profit Margin | Revenue required to generate 1 million profit[i] |
| Network and Other Communications Equipment | 20.4% | 4,901,961 |
| Internet Services and Retailing | 19.4% | 5,154,639 |
| Pharmaceuticals | 19.3% | 5,181,347 |
| Medical Products and Equipment | 16.3% | 6,134,969 |
| Railroads | 12.6% | 7,936,508 |
| Financial Data Services | 11.7% | 8,547,009 |
| Mining, Crude-Oil production | 11.5% | 8,695,652 |
| Securities | 10.7% | 9,345,794 |
| Oil and Gas Equipment, Services | 10.2% | 9,803,922 |
| Scientific, Photographic, and Control Equipment | 9.9% | 10,101,010 |
| Household and Personal Products | 8.7% | 11,494,253 |
| Utilities: Gas and Electric | 8.7% | 11,494,253 |
| Aerospace and Defense | 7.6% | 13,157,895 |
| Food Services | 7.1% | 14,084,507 |
| Industrial Machinery | 6.9% | 14,492,754 |
| Food Consumer Products | 6.7% | 14,925,373 |
| Electronics, Electrical Equipment | 6.5% | 15,384,615 |
| Commercial Banks | 5.2% | 19,230,769 |
| Telecommunications | 5.1% | 19,607,843 |
| Chemicals | 5.0% | 20,000,000 |
| Construction and Farm Machinery | 5.0% | 20,000,000 |
| Insurance: Life, Health (stock) | 4.6% | 21,739,130 |
| Information Technology Services | 4.5% | 22,222,222 |
| Computers, Office Equipment | 4.3% | 23,255,814 |
| Metals | 3.9% | 25,641,026 |
| Wholesalers: Diversified | 3.5% | 28,571,429 |
| Insurance: Property and Casualty (stock) | 3.3% | 30,303,030 |
| Specialty Retailers | 3.2% | 31,250,000 |
| General Merchandisers | 3.2% | 31,250,000 |
| Health Care: Pharmacy and Other Services | 3.0% | 33,333,333 |
| Packaging, Containers | 3.0% | 33,333,333 |
| Beverages | 2.9% | 34,482,759 |
| Engineering, Construction | 2.7% | 37,037,037 |
| Health Care: Medical Facilities | 2.4% | 41,666,667 |
| Health Care: Insurance and Managed Care | 2.2% | 45,454,545 |
| Petroleum Refining | 2.1% | 47,619,048 |
| Food and Drug Stores | 1.5% | 66,666,667 |
| Pipelines | 1.5% | 66,666,667 |
| Wholesalers: Health Care | 1.3% | 76,923,077 |
| Semiconductors and Other Electronic Components | 1.0% | 100,000,000 |
| Energy | 0.9% | 111,111,111 |
| Home Equipment, Furnishings | 0.7% | 142,857,143 |
| Food Production | 0.6% | 166,666,667 |
[i] To calculate the total sales required to generate a 1 million profit in any currency, 1 million was divided by the average net profit margin for each industry shown. The margins used in these calculations were taken from the discussion of the 2009 “Fortune 500” found at www.fortune.com.
Tagged in: Finance, Performance, Strategy


